Data and Visualization Services Projects
About this department: Data & Visualization Services helps students and researchers develop critical data literacy, data analysis, and visualization skills through expert consultations, workshops, and classroom instruction. The department provides support for a wide range of data activities including finding datasets, data cleaning and manipulation, data analysis, and data visualization.Please get in touch with us with your data-related questions. We offer support support over email, through appointments, or by instant message when available. We offer consultations online and in-person.We are also currently offering data and visualization workshops and instruction online and in-person. Contact us to… More about Data & Visualization Services
Projects on this page represent a selection of the work of this department.

Data Experience Lab (DXL) Discoverability Study
The Data Experience Lab (DXL) is the NC State University Libraries’ community hub for data science support and learning, as well as advanced desktop computing. We conducted a usability study to understand how students discovered the DXL inside the…
Completed on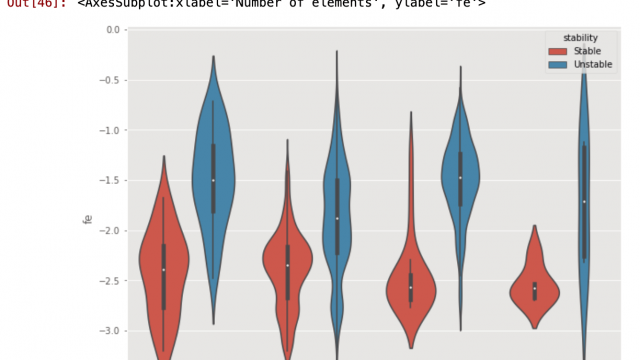
Empowering Undergraduate Research and Educational Experience with Data Science
Librarians in the Data & Visualization Services department partnered with researchers in the Department of Materials Science and Engineering to develop interactive data science instructional materials for a grant funded online educational…
Completed on
Optimal Routing for Parking Enforcement Vehicles
The City of Raleigh has begun using trucks outfitted with License Plate Recognition (LPR) equipment to streamline parking enforcement. Finding optimal routes for the trucks to evenly and efficiently traverse three sections of city streets that have…
Completed on
Mapping for Habitat for Humanity
Caldwell students create maps that help Habitat for Humanity communicate about regional housing needs to local leaders.
Completed on
Extracting Air Pollution Data for Coastal Recreation Sites
Many people spend time doing leisure activities such as swimming, running, and fishing along coastal shorelines and could be interested in knowing the amount of air pollution that exists in these marine environments. Ph.D. Economics graduate student…
Completed on
Visualizing Co-Authorship
We used free software to create an interactive packed circle chart visualizing Chemistry department co-authorship with other NC State departments.
Completed onCoffee & Viz Program Evaluation
Coffee & Viz is a forum for NC State researchers and others to share their visualization work and discuss visualization best practices. As the series approached its five-year anniversary and fiftieth event, we wanted to evaluate how…
Completed on")
Mapping to Visualize Inequality
Dr. Andrew Taylor, a professor of Political Science in the School of Public and International Affairs at NC State University, is writing a book provisionally titled, "Our Equitable Democracy: American Politics and Economic Outcomes in an…
Completed onDataspace Survey + Tiny Café
In January and February, 2019, we asked users for feedback on the Dataspace at Hunt Library. We were particularly interested to apply lessons from the Dataspace to planning work for the Data Experience Lab, slated to open in the D. H. Hill Jr.…
Completed on
Collaboration with User Experience
Software + Tiny Café
In February 2019, we held a pop-up user research station event, Tiny Café, where we found out more about our patrons’ software and programming needs.
Completed on
Tess-Celestial
Tess-Celestial is a visualization project that explores the interplay of art, nature, culture, shape, perspective, and math in our everyday lives.
Completed on
Augmented Reality Exhibit Usability Test
In July 2018, we conducted a usability test on ARt: Exhibition in 3D, an augmented reality (AR) art exhibit in the Technology Showcase in Hunt Library.
Completed onData Science and Visualization Space user research
In Spring 2018, we conducted a survey, follow-up interviews with surveyed faculty, and a focus group with graduate students to learn more about the computing, data, and visualization needs of our community. What we learned has helped us plan the…
Completed on