Extracting Air Pollution Data for Coastal Recreation Sites
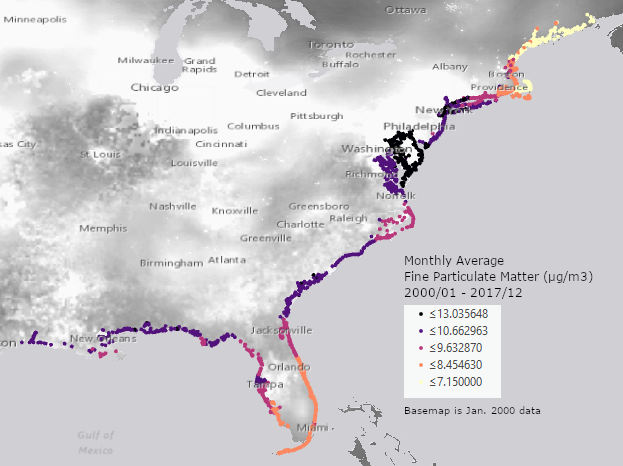
Many people spend time doing leisure activities such as swimming, running, and fishing along coastal shorelines and could be interested in knowing the amount of air pollution that exists in these marine environments. Ph.D. Economics graduate student Yiqing (Elaine) Liu's work is to study the economic impact of air pollution on coastal recreation activities. She found monthly particulate matter air pollution raster data that is generated by researchers at Dalhousie University* for the entire United States, and sought to extract values of fine particulate matter for 2,971 registered public saltwater fishing access sites along the Gulf and Atlantic coasts.

Overview
In December 2019, Liu contacted Data & Visualization Services for help extracting air pollution values from rasters representing monthly particulate matter data for 2000-2018. The data needed to be extracted to coastal area recreation site points, from Maine to Louisanna. Data & Visualization Services Librarian Jeff Essic met with her to develop a workplan using GIS software.
How We Did It
Existing raster data produced by Dalhousie University researchers and openly available through ftp was downloaded, unzipped, and converted from ASCII format to Esri grids in multiple batch processes. The first challenge was to rename the ASCII files to fit the 13-character grid name limitation, which was accomplished using DOS commands and Excel to create a renaming batch file. This resulted in 216 grids, totaling over 6GB in size.
The fishing sites are from the NOAA National Marine Fisheries Service, provided as a CSV spreadsheet containing the latitude and longitude of each site. There were some erroneous coordinate values which we were able to clean. The site data were imported into ArcGIS Pro, and the Analysis Tool "Extract Multi Values to Points" was then executed to pull the raster air pollution data to the site locations. To improve the accuracy of the value extraction, the tool was run with Bilinear Interpolation turned on. The volume of the extracted data necessitated storing the output in a file geodatabase.
The majority of the recreation sites were located where they overlaid the grids. However, because these are coastal locations, 71 sites were located just beyond the raster cell edges, and thus no air pollution data could be extracted. The solution was to convert a manually delineated band of raster cells to polygons, and snap the outside points to the closest polygon edge in order to obtain the closest possible pollution values. Most points snapped to the inside of the polygons, but a few snapped to the outside and had to be manually moved inside the polygon. Once this was done, pollution values for the outlying points were extracted and merged with the previously analyzed points.
* van Donkelaar, A., R. V. Martin, et al. (2019). Regional Estimates of Chemical Composition of Fine Particulate Matter using a Combined Geoscience-Statistical Method with Information from Satellites, Models, and Monitors. Environmental Science & Technology, 2019, doi:10.1021/acs.est.8b06392. [Link]
