Creating Network Graphs in Gephi: Let's Get Visual!
Friday, October 30, 2020
12:00pm to 1:30pm
Online only
View upcoming workshops
About This Workshop
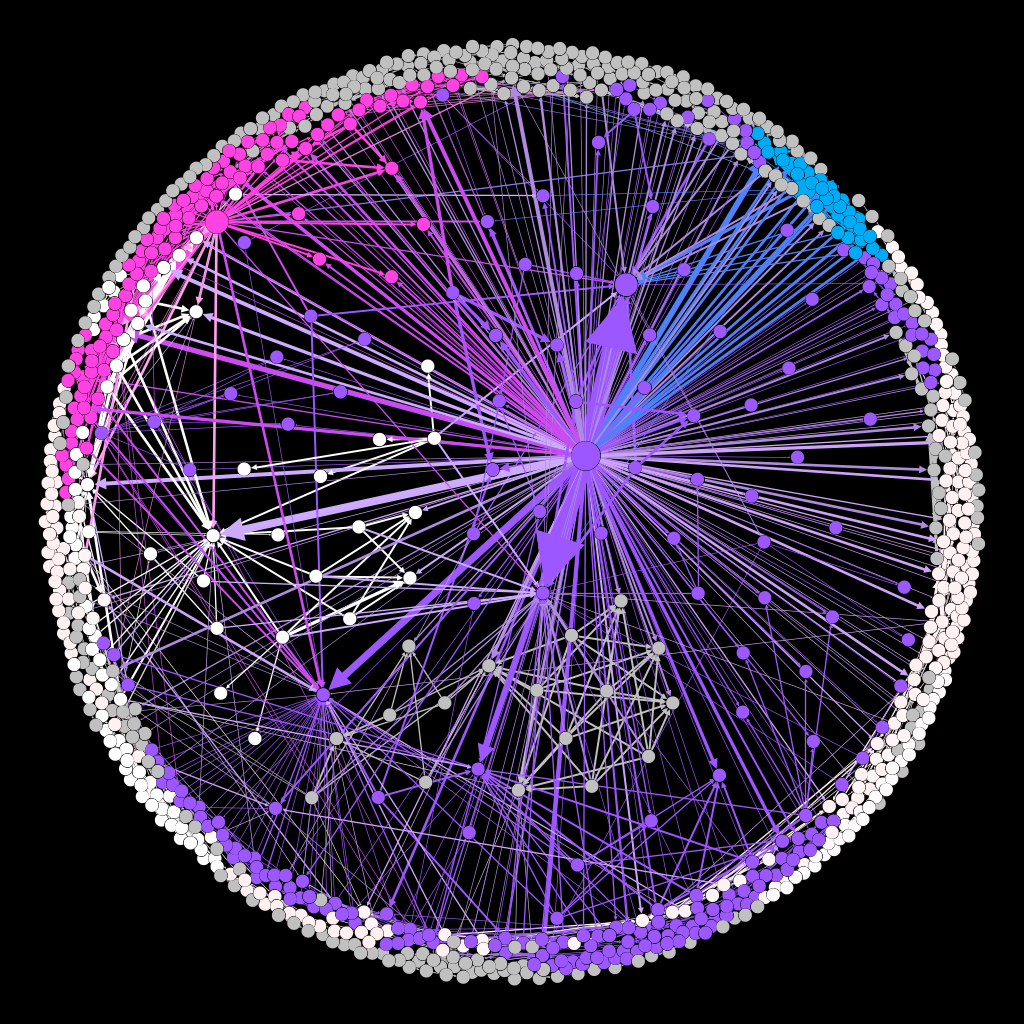
Looking for alternative ways to showcase data? Analyzing information using visualizations is one of the most efficient ways to both "distant read" and convey data; one way to create these visualizations is through graphing and network software. This workshop will focus on the program Gephi, the Open Graph Viz Platform. In this session, in addition to building visually-striking graphs, you will learn methods to interpret the information with data and network analysis. By using Gephi, datasets stand out for your audience and makes research "pop," particularly in conference or poster presentations. This is a hands-on workshop, so participants may either bring their own datasets or practice using one that has been prepared in advance.
Speaker Biography: James is a Ph.D. candidate and Graduate Assistant studying under the supervision of Dr. Timothy Stinson and focusing on Medieval Media Studies and Digital Humanities. His research analyzes the 13th-century communication network established by petitionary texts to Edward I. He also is a Graduate Research and Instructional Assistant with the Innovation Studio at the NC State Library.
When
Friday, October 30, 202012:00pm to 1:30pm
Where
Instructors
 James Harr IIIPh.D. candidate & Graduate Assistant
Accessibility
If assistive technology, live captioning, or other accommodations would improve your experience at this event, please contact us. We encourage you to contact us early about this to allow sufficient time to meet your access needs.