Visualizing Space, Time and Comic Books: Approaches to 9/11
April 23, 2015
What is the difference between space and time when it comes to telling a story? In order to help her students understand the difference, Professor Helen Burgess had her students look at different representations of the events of 9/11. With the help of librarians Markus Wust, Jamie Bradway, and Brian Dietz, Burgess displayed 9/11 timelines, information graphics, and comics on the walls of the Visualization Studio at D.H. Hill Library. The goal? To give students an opportunity to reflect on how the format we use to tell a story can change the way we think about that story.
Using the Visualization Studio
Working in groups, students projected large-scale graphics, images and text pertaining to 9/11 onto the four walls of the Visualization Studio. The first wall showed images and textual representations of the events that occurred on 9/11: a newspaper graphic from the Pittsburgh Post-Gazette with a written summary, a timeline of the events on each of the hijacked planes, and the FBI’s official version of what happened that day laid out on a small map with a list of events and times.
The second wall displayed a portion of the 9/11 Report (Sid Jacobson and Ernie Colón, The 9/11 Report. A Graphic Adaptation. Hill and Wang, 2006), a graphic novel depicting the events of 9/11. The portion of the graphic novel used consists of four parallel timelines conveying different events. The goal here was for the students to investigate how the use of “time” as the primary structuring of a narrative is different than, say, space.
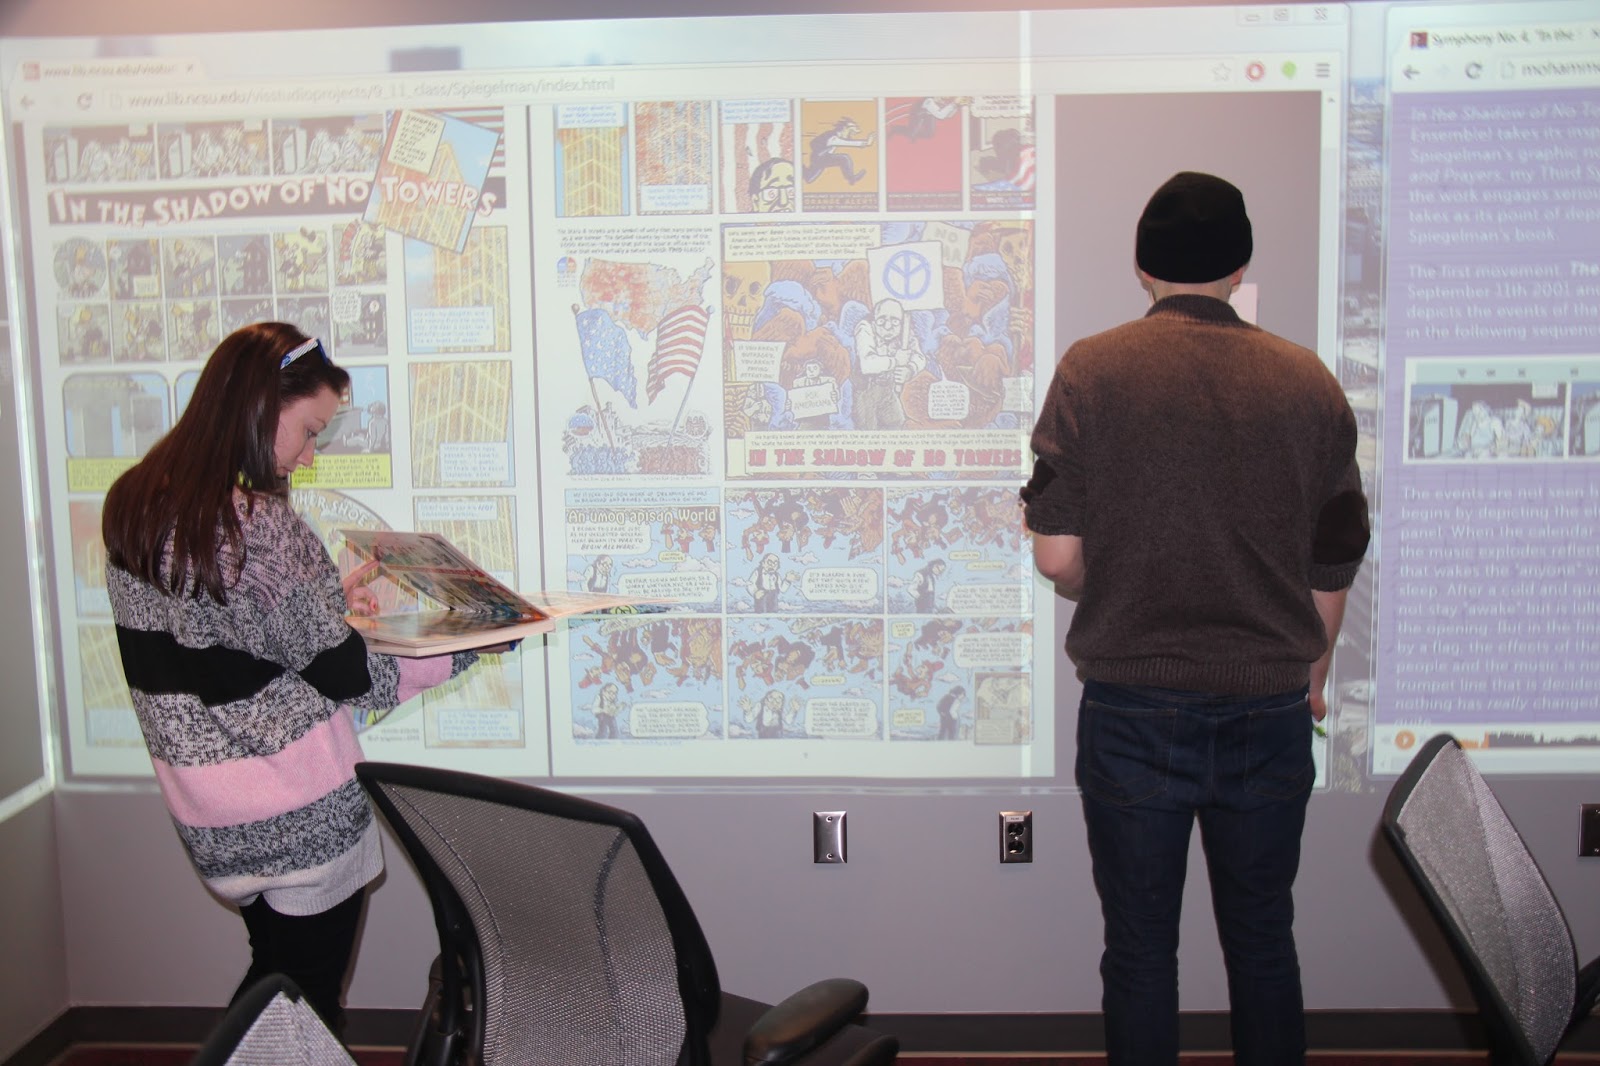
Two pages from Art Spiegelman’s graphic novel In the Shadow of No Towers (Pantheon: 2004) covered the third wall. The students explored the content to analyze how the aftermath of 9/11, especially the emotional ramifications, were being represented in the format of a comic. The students looked at how the various design features of comics were used to tell the stories, such as panels that stretch to different lengths and heights, varying directions of panel readings, and more.
 Aaron Jones and Jon Wall
Finally, a large, editable Google map was projected on the the fourth wall. The students worked from the textual information projected on the first wall -- newspaper content, FBI report, and the timeline -- and used it to drop pins onto the Google map to highlight where each event happened. This activity helped the students think about the narrative surrounding the events of 9/11 related to each other at different locations. The primary narrative structure was “space.”
Over the course of two sessions, 19 students interacted with the walls. They benefitted from the Visualization Studio's available large screen real estate which allowed them to simultaneously display all relevant visual materials. One group was in charge of dropping pins and filling in descriptions of events on the Google map. The groups working on the timeline and Spiegelman walls used their knowledge from Edward Tufte’s work on information representation and Scott McCloud’s work on comics. They used sticky notes to mark places on each wall that they thought were significant in some way, and developed discussion points that analysed how timelines and comics worked to create differing interpretations of the same story.
At the end of the sessions the Studio's large display area became even more important when the groups got back together and discussed the results from each exercise and compared the different formats on each wall.
Talking about how students benefitted from working in the Visualization Studio, Dr. Burgess stated that "the biggest thing was the spatial affordances the room offered. Especially with the maps & timelines, students could really get to grips with multiple texts at a time [...]. Also, it added a whole new dimension to the timeline sequence in the 9/11 report, which really needs to be seen as a whole rather than flicking through pages."
Featured Staff
 Markus WustFormer Digital Research and Scholarship Librarian
 Brian DietzLead Librarian for Collections Stewardship and Discovery
 Jamie BradwayPreservation Librarian
External Staff
 Helen BurgessAssociate Professor of English
Upcoming Events
Jul
26
Undergraduate Research and Creativity Summer Symposium
9:00am to 5:00pmJul
26
SECU Public Fellows Showcase
10:00am to 12:00pmJul
31
A Series of Questions - Trivia Series
12:15pm to 1:00pmAug
7
Paws for a Break
12:00pm to 1:00pm