PolicyMap in action
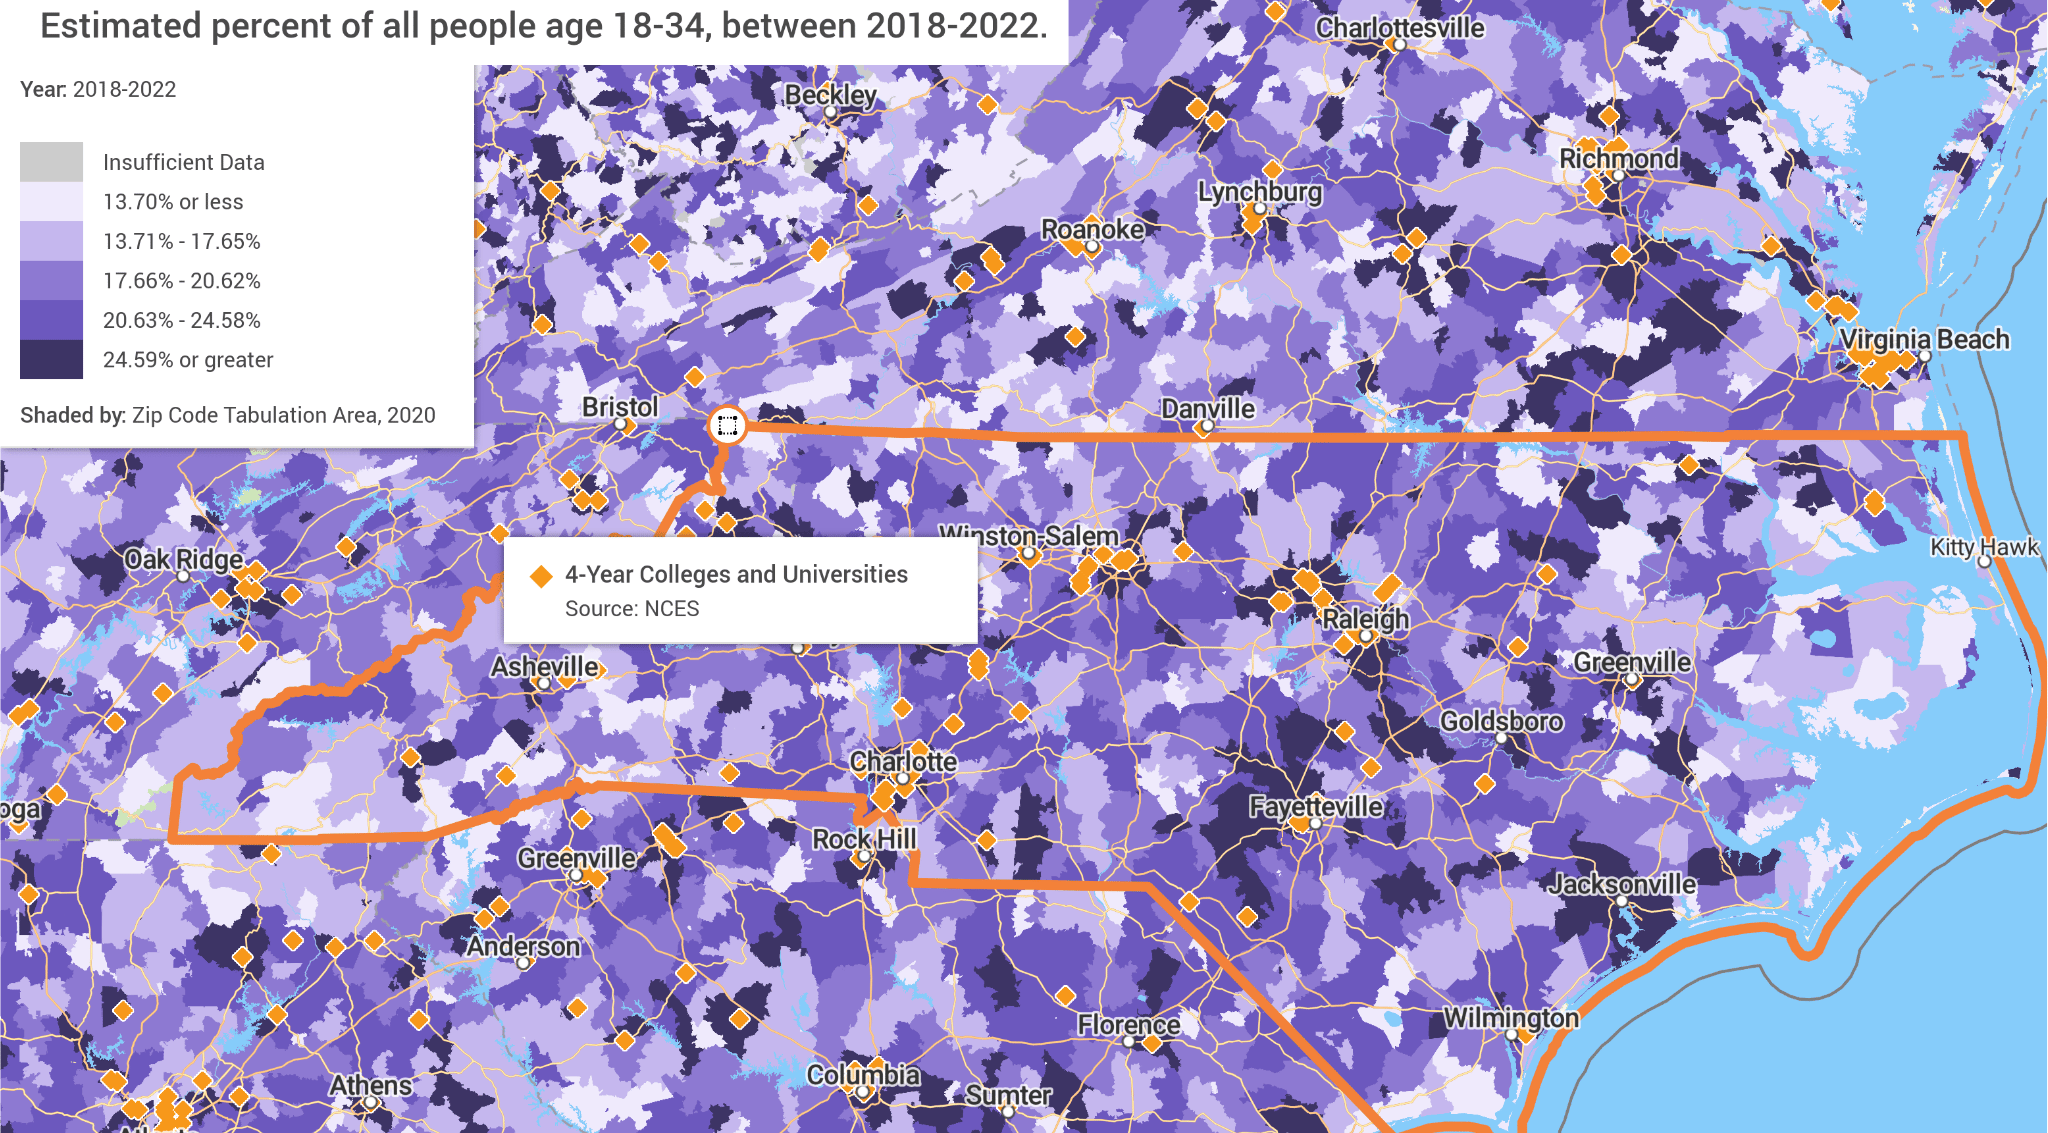
The NC State University Libraries is happy to introduce PolicyMap, our newest policy mapping tool. According to their website, PolicyMap offers an innovative platform that extends beyond conventional GIS and planning departments, catering to diverse research interests. With PolicyMap, researchers can harness sophisticated data, mapping, and analytics tools to delve deeper into critical areas within their respective disciplines. PolicyMap’s extensive data library comprises thousands of indicators sourced from hundreds of reliable resources, ensuring standardized and cleaned data. This approach eliminates the need for tedious searches across disparate sources, empowering students, and to create insightful maps, reports, and analyses effortlessly.
Tom Birkland, Associate Dean for Research in the College of Humanities and Social Sciences, recommended that the NC State University Libraries obtain this resource for our campus community. In his endorsement of PolicyMap, Dr. Birkland stated: "PolicyMap is an extremely valuable resource because it brings together so much important data in one place in a way that is immediately useful to researchers. It contains a wealth of demographic, policy, and economic data that would be difficult to gather from disparate sources. I am looking forward to using it in my research."
PolicyMap is a multidisciplinary database that can benefit researchers in a variety of fields including but not limited to:
Regardless of your discipline, PolicyMap may be the right tool for you if you are working on a geographic analysis project that needs:
If you would like to learn more about using PolicyMap, here are some resources available on the PolicyMap website:
If your project requires assistance with more advanced GIS mapping software or geospatial data, please visit the NC State University Libraries’ GIS webpage for more resources.
PolicyMap can be used in a variety of ways both in and out of the classroom by the NC State campus community. Some examples include but are not limited to:
Learn how researchers have strengthened grant applications by using PolicyMap’s databases and visualizations capabilities:
More information on how PolicyMap can be used to support grant applications can be found here.
Whether you're a professor thinking about integrating PolicyMap into your curriculum or a student considering its use for a class project, here's how others have utilized PolicyMap in the classroom:
PolicyMap’s multidisciplinary platform also makes it a great tool for multimedia projects. Learn how one researcher used PolicyMap in their photography project down below:
Have you used PolicyMap in an interesting way and would like your project to be considered for a future Collections Highlight? Reach out to Anna Cohen at amcohen@ncsu.edu for more details.
Absolutely! Please take a moment to submit an appointment request to book a 30-minute help session with a Data Science Consultant about data and visualization topics. Please provide a brief description of your project and your interest in PolicyMap, and we'll connect you with a consultant who can help.